Hobor Documentation
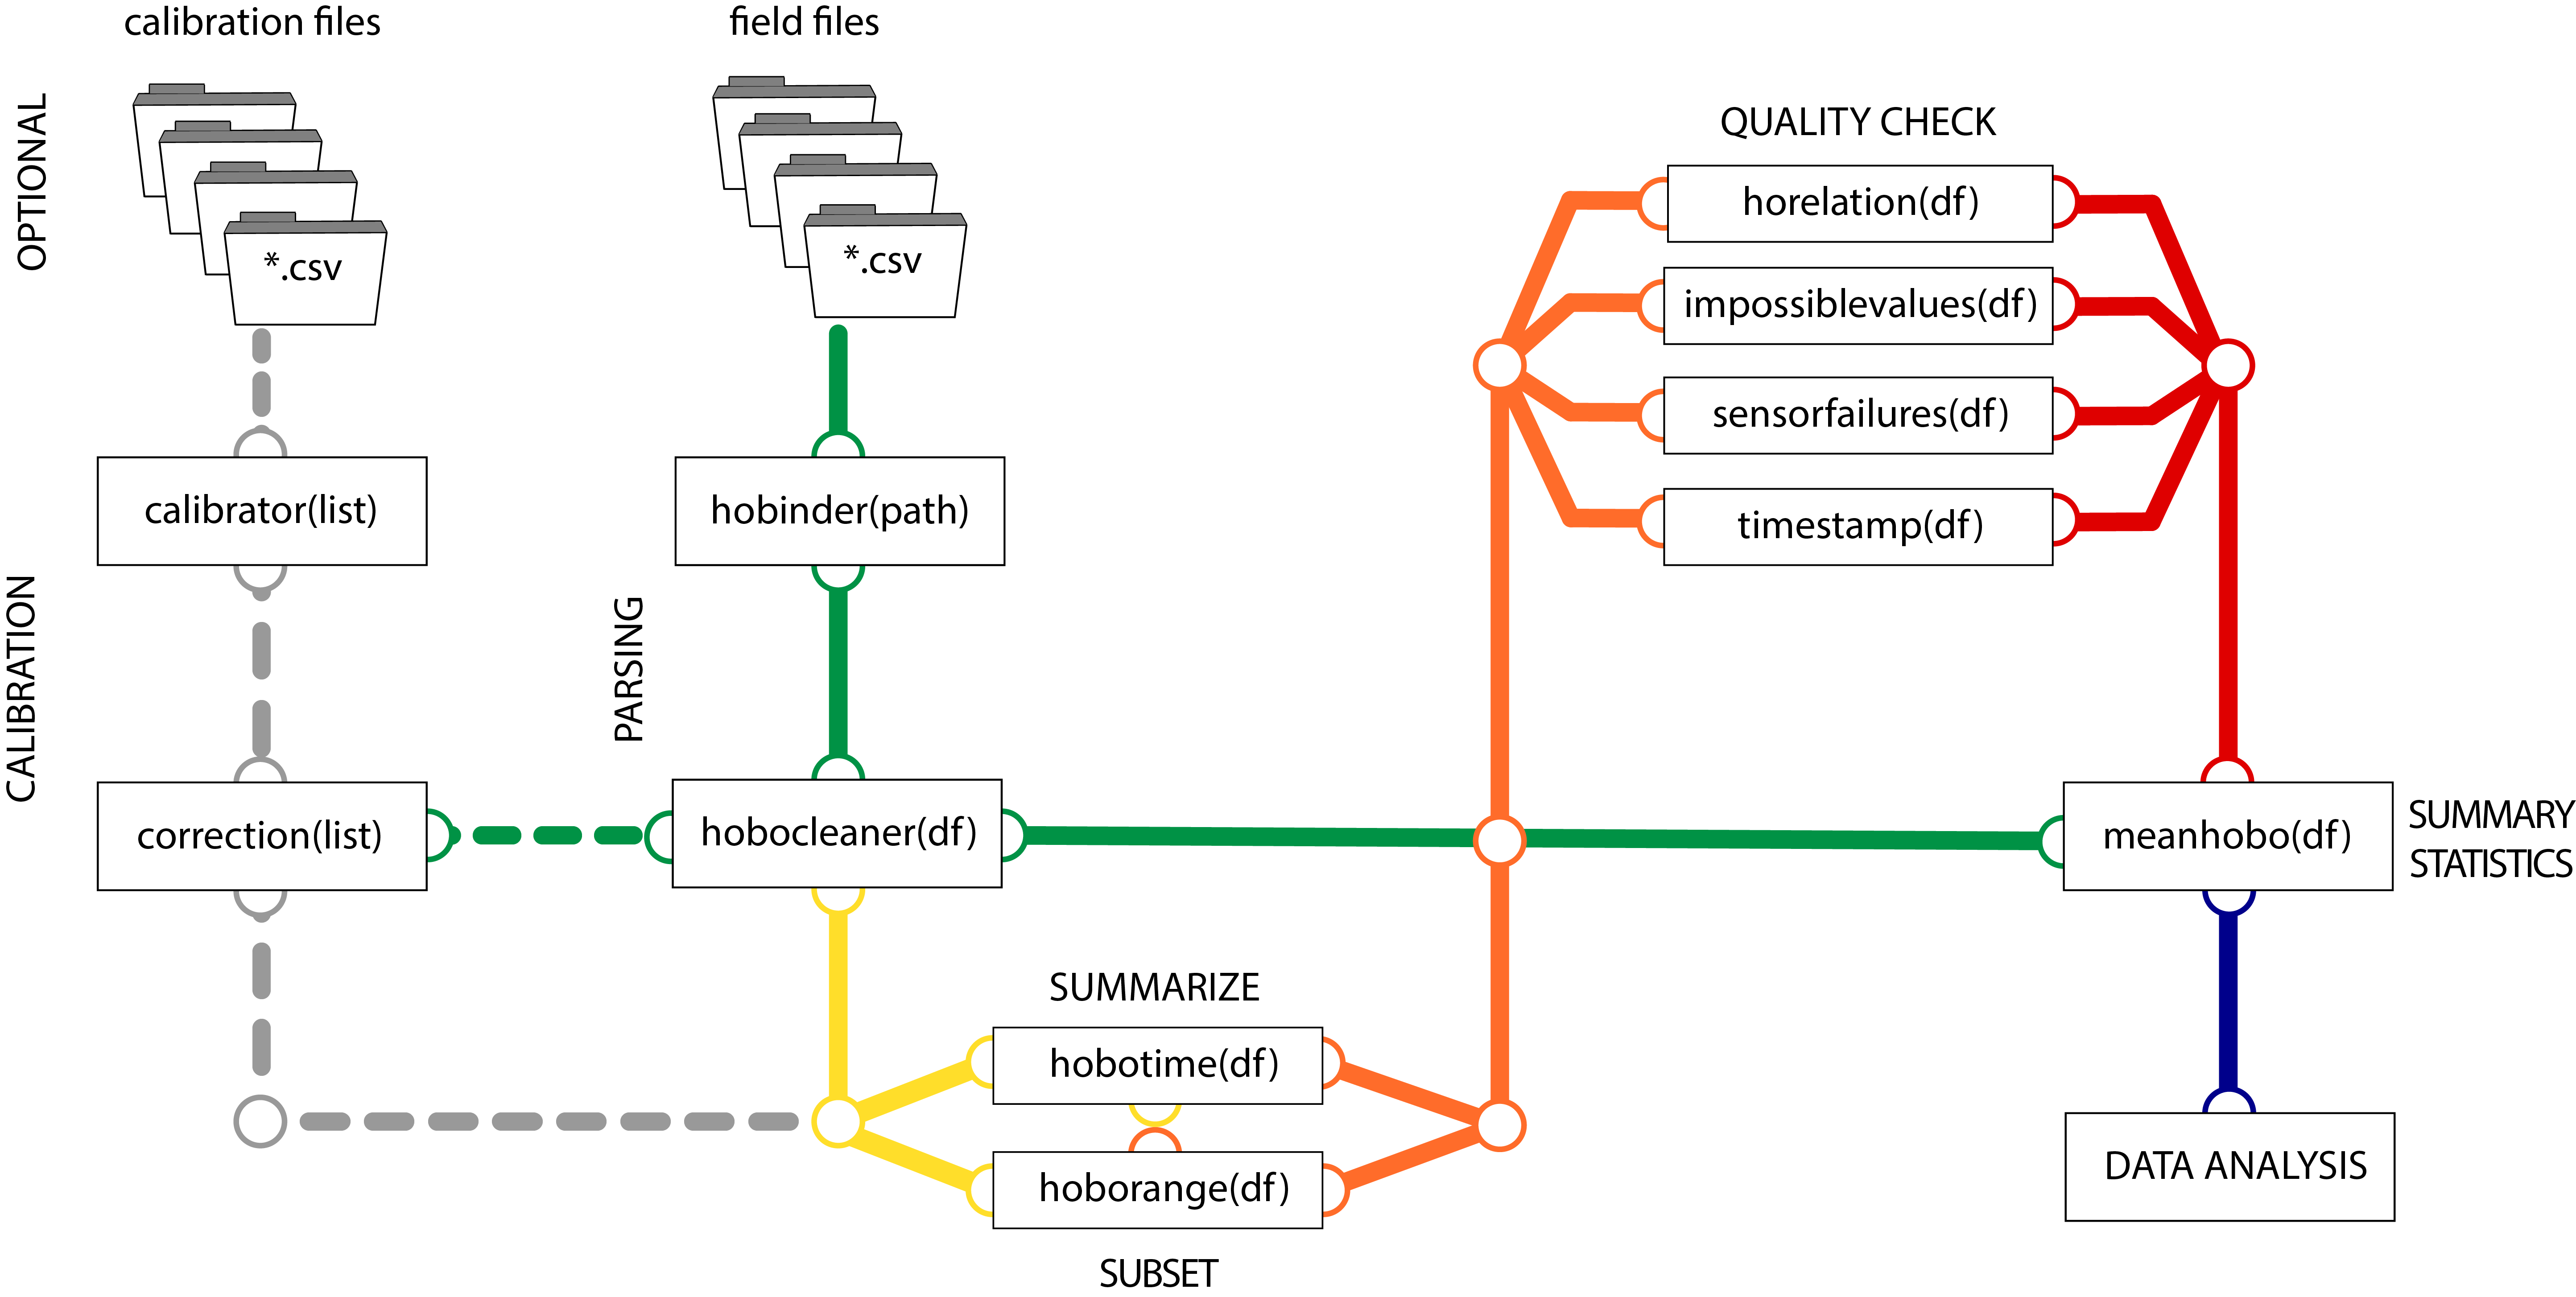
HOBOR Diagram Usage
Data Availability
We provide two data sets to test the package hoboR, one location from Southern Oregon from October to January, with recorded data every minute used to test the incidence of SOD in tanoek trees (Notholithocarpus densiflorus), and a partial calibration experiment to determine the variability of HOBO data loggers and apply a base correction.
HOBOR components
| Function | Description | Features |
|---|---|---|
| hobinder() | loads all CSV files | some columns in hobo files start at position 2, use skip=1 to skip col 1 |
| hobocleaner() | clean duplicate entries | choose the format = “ymd” output from your HOBO |
| hobomeans() | summarise the data by a time interval | you can select summariseby = “5 min”, “12 h” or “1 day” |
| hoborange() | selects a reange of dates | choose existing dates within your hobo files start=”2022-06-04” and end=”2022-10-22” |
| hobotime() | summarise time in minutes, hours or days | summariseby = “5 mins” or “24 h” |
| impossiblevalues() | shows the maximum and minimum values | Select the number of rows to displya showrows = 3 |
| sensorfailures() | detect the sensor failures and impossible values | select the conditional if values bigger than a threshold in the measurements of election condition = “>”, threshold = c(50, 3000, 101), opt = c(“Temp”, “Rain”, “Wetness”)) |
| timestamp() | get a snapshot and plot the interval of your election for n days | timestamp(hobocleaned, stamp = “2022-08-05 00:01”, by = “24 hours”, days = 100, na.rm = TRUE, plot = T, var = “Temp”) |
| horrelation() | display the correlation between variables | The data can be summariseby time and by means |
| calibration() | collect the data frames and calculate the variability of respect to a base HOBO | this function require the columns of interest, and the times to collect the data for calibration |
| correction.test() | use the result of the calibration procees to test the accuracy of the data logger | select the treshold difference for the measuremnt to test |
| correction() | correct the experimental data using the weather variable of interest of the full dataset | useful for individual or multiple corrections |
| testhobolist() | if calibration() or correction() do not compute, test the list of hobo dataframes | checks data viability |
| samplingrates() | calculate the total of samples collected | custom function for Carson et al., 2024 |
| sampling.trends() | summarises the weather data by sample collection | custom function for Carson et al., 2024 |
Funded by:
![]()